Reliability: uptime checks and charts
A green deploy says a release started. The Reliability tab of every app says whether its services actually work, how fast they answer, when they were down, and whether a release changed any of that.
What gets checked
Once a minute, the platform checks every service of every app. Services scaled to zero are skipped, and so are apps that have no release yet: an app waiting for its first build is not down, so it is not reported as an outage.
| Check | How | What it catches |
|---|---|---|
| Inside the cluster | GET the service's health.path through its Service (http://<service>.<app>.svc.cluster.local/<path>); without a health check, opens a TCP connection to its port |
the app itself: crashes, hangs, a broken release |
| Public URL | GET https://<domain><health path> through the public internet and Cloudflare, like a visitor |
everything in front of it too: DNS, Cloudflare, the router, ingress, the certificate |
When the inside check passes and the public one fails, the problem is in front of the app. When both fail, it's the app.
- An HTTP check passes on any 2xx or 3xx status. Redirects are not followed: a redirect to a login page means the service answered. A public check of a service without a health path requests
/, so it passes on any status below 500: an API with nothing at/still answers 404, which proves DNS, Cloudflare, ingress and the app are all up. - Each check has 10 seconds.
- Checks send
Cache-Control: no-cache, so Cloudflare passes them to the origin. - Requests carry the user agent
rendimiento-uptime/1. They fetch the health endpoint or page without running JavaScript, so analytics like Umami don't count them as visits.
No setup is needed. A health: check in rendimiento.yaml makes the inside check more meaningful (a page that renders, not just an open port), so add one where you can.
Reading the tab
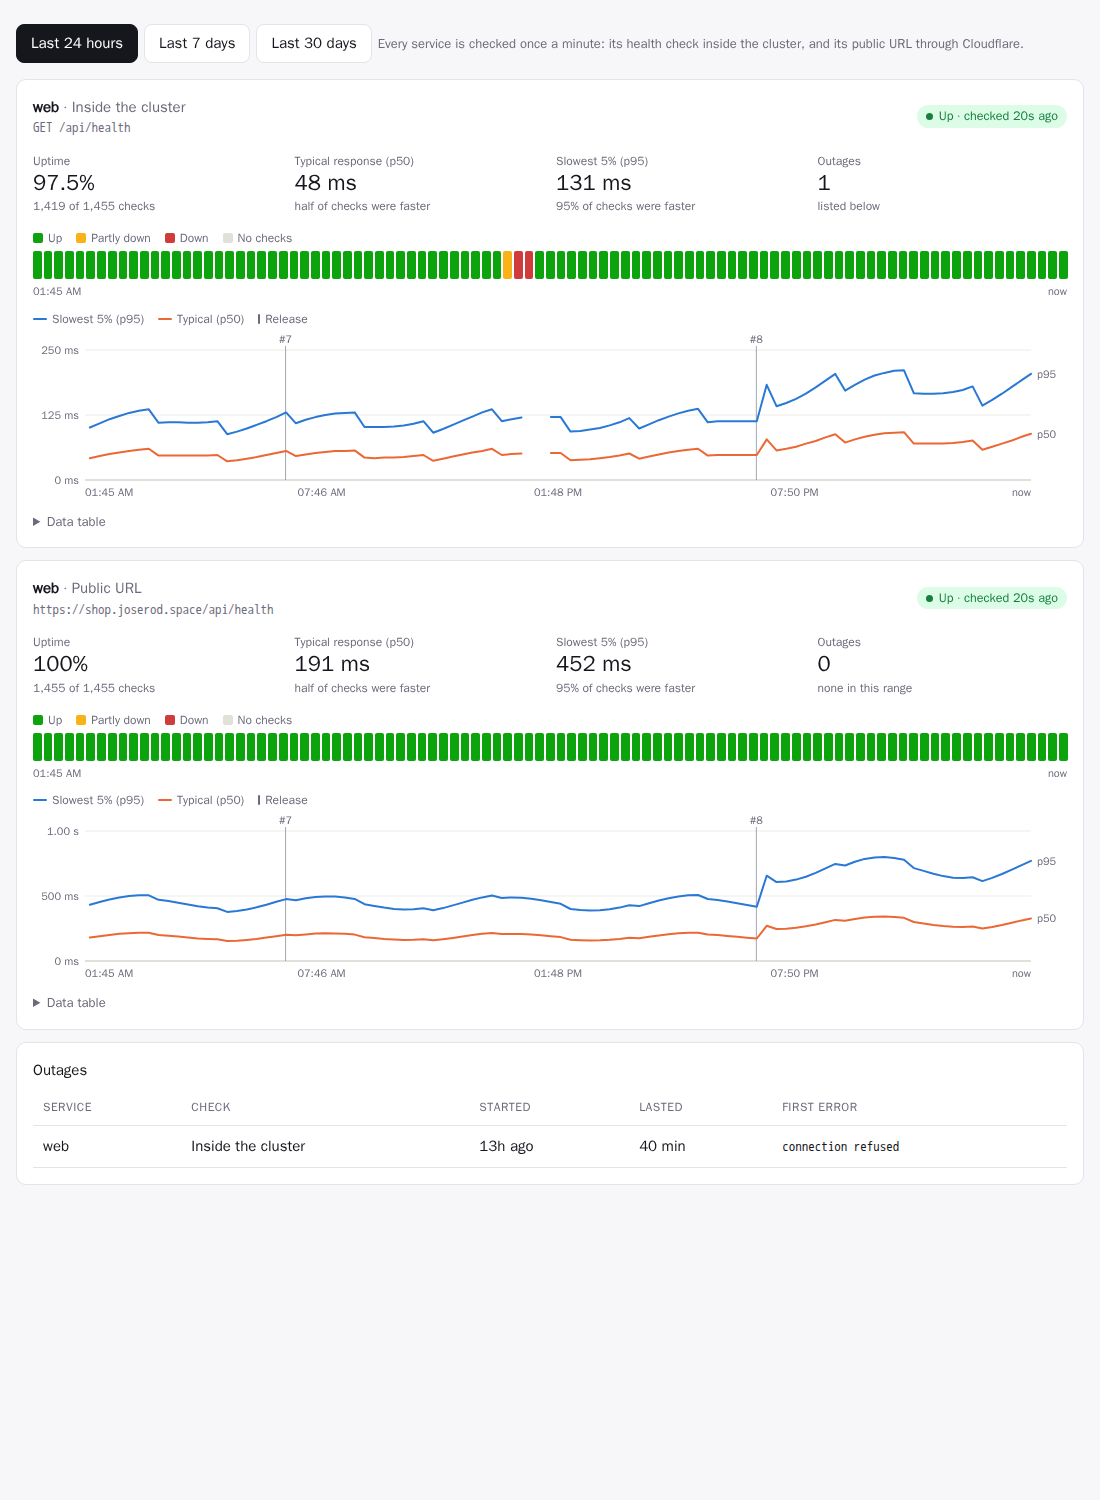
Pick Last 24 hours, 7 days or 30 days. Every check gets a card:
- Tiles:
- Uptime: the share of checks that succeeded.
- Typical response (p50): half the checks were faster.
- Slowest 5% (p95): 95% of checks were faster. This is what your slowest visitors see.
- Outages: how many there were in the range.
- The badge in the corner is the latest check: up or down, and how long ago.
- Status strip: one cell per 15 minutes (24h), hour (7d) or 6 hours (30d). The cells are Up, Partly down (some checks failed), Down (most failed) or No checks. Hover a cell for its numbers.
- Response time chart: p95 and p50 over time. Release markers (
#7,#8) show when each release went out, so a slowdown that starts at a release is obvious. A gap in the lines means no check succeeded then. Hover for exact values and any release in that slot.
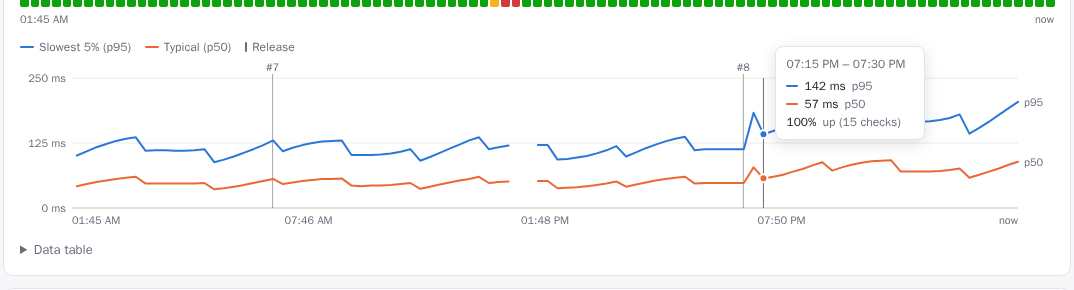
- Data table: every number in the chart, without hovering.
- Outages: each outage with its service, check, start, duration and first error.
The dashboard shows each app's 24-hour uptime on its card:
| Badge | Uptime |
|---|---|
| green | 99.9% or more |
| amber | 98% or more |
| red | below 98% |
Outages
An outage starts after two failed checks in a row, dated from the first one. One failure alone is usually a blip, such as a pod restarting or a slow response. The outage ends at the next successful check. Outages survive platform restarts: a restarted platform picks up the open ones and closes them when the service recovers.
Verifying each release
Every release on the default branch is watched after it goes live, and a release that breaks a service is rolled back automatically.
flowchart LR
    rel[release #8 goes live] --> roll{rollout healthy<br/>within 10 min?}
    roll -- no: crash loop, failed rollout --> fail
    roll -- yes --> watch[check every service<br/>every 20 s for 5 min]
    watch --> judge{a check that worked<br/>before now fails?}
    judge -- no --> pass[Verified]
    judge -- yes --> fail[Failed]
fail --> back[roll back to the last<br/>good release, as #9]- The rollout: the release must become healthy within 10 minutes, meaning every pod on the new version and ready. A rollout that fails or crash-loops fails verification right away.
- The window: for 5 minutes, every check of the release (inside the cluster and public) runs every 20 seconds.
- The verdict. A check fails the release when at least 3 of its checks, and at least a fifth, failed, and it was healthy (90%+ up) in the hour before the release, or is new. Two exceptions:
- A check that was already failing before is reported but not blamed on the release.
- A release that's much slower (p95 three times higher, and a second more) is reported, not rolled back, because cold caches make that noisy.
- The rollback: a failed release is rolled back to the newest earlier release that didn't fail verification, as a new release (
rollback to #7). Rollbacks, manual or automatic, aren't verified again, so there's no rollback loop.
The result shows on each release in the Releases tab, with the reason:
| Badge | Meaning |
|---|---|
| Verifying… | being watched now |
| Verified | healthy for the whole window |
| Failed · rolled back | broke a service, and the last good release is back |
| Failed verification | broke a service, kept because verify.rollback: false or there was nothing to return to |
| Not verified: replaced | a newer release (or a manual rollback) came before the window ended |
While a release is verified, and for a day after one fails, a banner on the app's page says so. On the response-time chart, a rolled-back release's marker reads #8 ✕.
Per app, in rendimiento.yaml:
verify:
  window: 600        # watch for 10 minutes (60–3600 s; default: the platform's 5 min)
  rollback: false    # only report a failed verification
  # disabled: true   # don't verify this app's releases
The platform-wide window is VERIFY_WINDOW (default 5m, 0 turns verification off). Verification runs on the leader. If the platform restarts mid-window, the release is watched again from the start, unless a newer one replaced it.
Public stats
With PUBLIC_STATS=true, rendimiento publishes aggregate numbers at GET /api/public/stats for a public page. joserod.space uses it for its Live from the Home Lab section.
With STATS_LISTEN set (:8081 here), the stats are served only on that internal port, which the Service exposes as stats and the public Ingress doesn't route. The page fetches them server-side over the cluster network (http://rendimiento.rendimiento-system.svc.cluster.local:8081/api/public/stats), so they're reachable from inside the cluster but not from the internet.
| Part | Contents |
|---|---|
delivery30d |
deploys, builds and their success, typical build and push-to-live times, verified and failed releases, automatic rollbacks, outages and mean recovery, deploys per day |
sites |
every public URL check: up now, uptime over 24 h and 30 days, typical response time, daily uptime for 90 days, hourly for 48 hours |
cluster |
pods and apps, and per node a generic label (control plane, worker 1…, GPU node), architecture, readiness, CPU and memory, pods, GPUs |
recent |
the latest releases: app, number, time, verification result, whether it was an automatic rollback |
It's deliberately vague about the setup. There are no node names, operating systems or software versions (an exact version tells an attacker which known vulnerabilities to try), and no addresses, secrets, commit messages or authors. It's computed at most once a minute.
Where the data lives
Results are kept in rendimiento's own Postgres, so it works without any monitoring stack:
| What | Kept | Used by |
|---|---|---|
| every check | 7 days | the 24-hour charts, exact percentiles |
| hourly summaries (checks, successes, p50, p95) | 400 days | the 7- and 30-day charts |
| outages | always | the outage list |
On the 30-day view, a bucket's p95 is the highest of its hours' p95s, an upper bound. See the data chapter.
The latest result of every check is also exported as Prometheus metrics on METRICS_ADDR (:9090):
- rendimiento_uptime_up
- rendimiento_uptime_latency_seconds
- rendimiento_uptime_checks_total
That's ready for Grafana once it's scraped.
Settings
| Setting | Default | |
|---|---|---|
UPTIME_INTERVAL |
1m |
How often to check; 0 turns checks off. |
In the code
| Piece | Where |
|---|---|
| What to check, running checks, outages, metrics | internal/uptime (Targets, Checker, Prober) |
| Release verification and automatic rollback | internal/platform/verify.go (startVerification, judge, rollbackTo) |
| Storage, summaries, chart queries | internal/store/uptime.go, migration 0005_uptime.sql |
| The API | GET /api/apps/{app}/reliability in internal/api/reliability.go |
| The charts | web/src/components/reliability.tsx: plain SVG, no chart library |
Next: post-deploy tasks (smoke tests and migrations run against the new version, inside the app's namespace) as part of verification. See the roadmap.